Thoughts, reflections, and first-hand encounters in finance, operations, human behavior, and the economics of sports.
Category: My Money Philosophy
Welcome to the enlightening realm where our human brain meets the complexities of money. It’s no secret that our brains aren’t always rational economic actors, especially when emotions come into play.
Finances have a profound emotional impact that often goes unnoticed. This section aims to delve into the fascinating ways our brains fail us when it comes to money matters.
At the heart of my money philosophy are two simple principles: automation and a long-term perspective. By automating financial processes and maintaining a forward-looking mindset, we can set ourselves up for success.
Let their wisdom and teachings guide you on a path towards financial clarity and empowerment. Together, let’s uncover the mysteries of money, overcome our human biases, and forge a prosperous future.
"People who always give nothing are rational fools who blindly follow material self-interest." --- Richard Thaler (2016)
Inspired by Richard Thaler’s Misbehaving: The Making of Behavioral Economics, the “Rational Fool” serves as a whimsical yet thought-provoking representation of the human tendency to act against our own best interests despite possessing rational capabilities. This concept, rooted in behavioral economics, challenges the traditional economic assumption of humans as perfectly rational decision-makers.
This drawing aims to spark curiosity and discussion around the fascinating intersection of psychology and economics, highlighting the importance of understanding behavioral biases in our everyday lives.
Through this playful visual metaphor, I invite visitors to explore the intriguing complexities of human behavior and decision-making, ultimately encouraging a deeper appreciation for the nuances of our choices.
Downloadable Content – Raw Notes
Interested in diving deeper into Richard Thaler’s work on Misbehaving? Download my unfiltered notes below 👇
"Success with money relies more on Psychology than Finance,and doing well with money has little to do with how smart you are, and a lot to do with how you behave. And behavior is hard to teach, even to really smart people." --- Morgan Housel (2020)
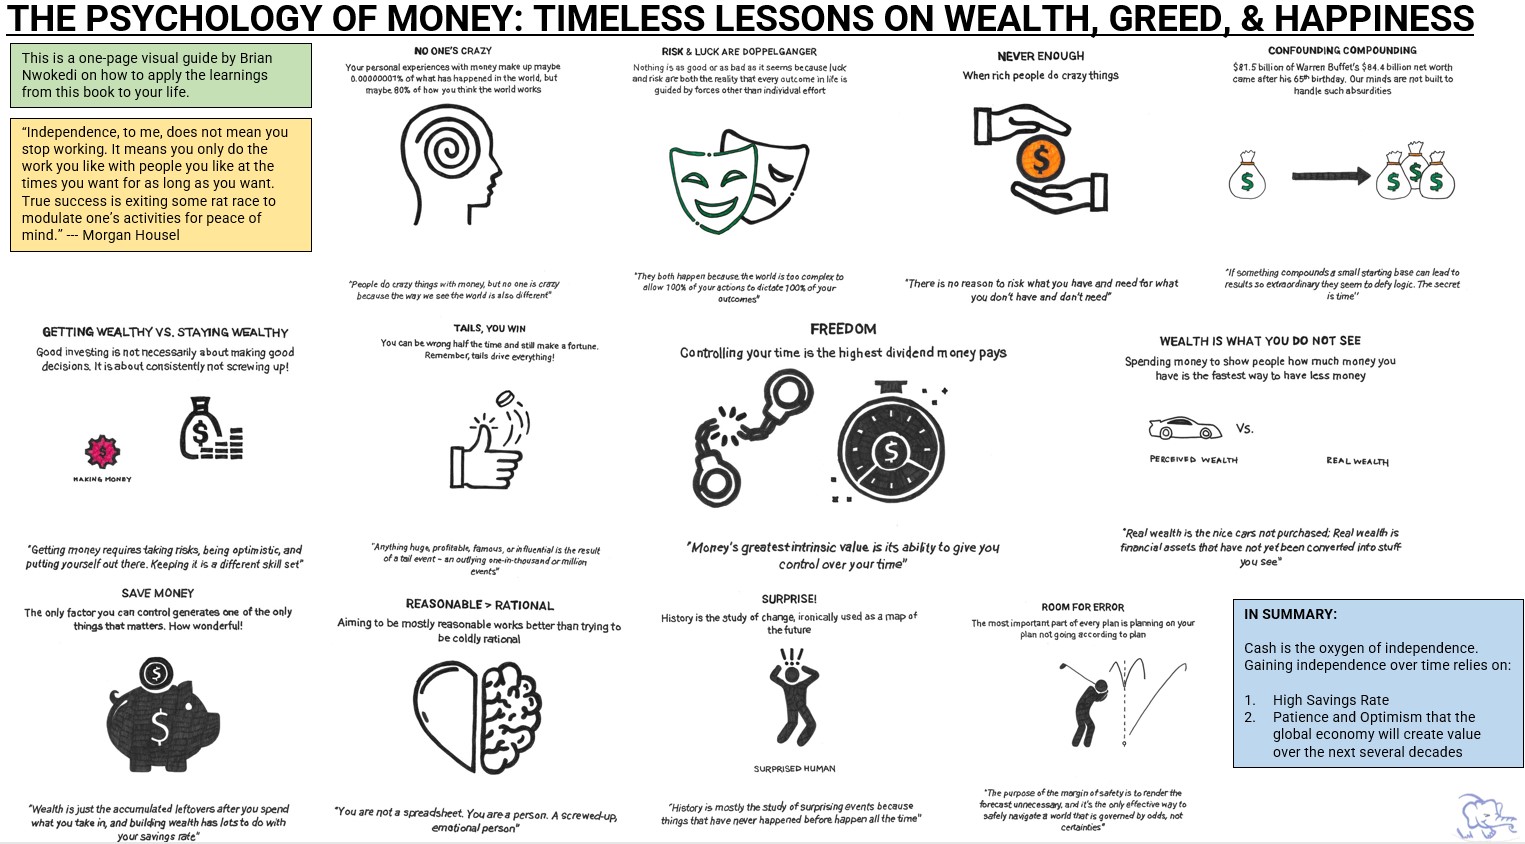
“The Psychology of Money“ by Morgan Housel is an insightful guide that puts the spotlight of financial success squarely on the shoulders of human behavior. In this world of complexity, how you behave with money is more important than what you know about money.
With a blend of research, anecdotes, and stories of personal experiences, Housel illuminates the significance of better understanding your own behavior, and how that is far more responsible for your financial outcomes than your skill.
The following one-page visual guide has been created by me to help you apply the teachings from Morgan’s book to your life. See below 👇
Downloadable Content – Raw Notes
Ready to dive deeper into Morgan Housel’s work on The Psychology of Money? Download my unfiltered notes below 👇
“However, I am confident in saying that if you can figure out a way to save 10% to 20% of your income into the financial markets each year, automate your savings and all of your bill payments, increase the amount you save each year by just a little, diversify your investments, and basically leave them alone, you will be better off financially than the vast majority of retirement savers in America. Everything else is gravy.” --- Ben Carlson(2020)
“Everything You Need to Know About Saving for Retirement“ by Ben Carlson is a succinct yet insightful guide that puts the spotlight on a fundamental aspect of retirement planning: your savings rate. In a world of complex investment strategies and ever-changing financial landscapes, Carlson distills his wisdom into a straightforward message – it’s not just about where you invest, but how much you save.
With a clear and approachable style, he emphasizes that building a secure retirement is within reach if you focus on increasing your savings and maintaining a consistent approach. Drawing on his expertise in personal finance, Carlson’s concise and no-nonsense approach empowers readers to take control of their financial destinies, offering a roadmap to achieving financial security during retirement through a smart savings strategy!
The following one-page visual guide has been created by me to help you apply the teachings from Ben’s book to your life. See below 👇
Downloadable Content – Raw Notes
Ready to dive deeper into Ben Carlson’s work on Saving for Retirement? Download my unfiltered notes below 👇
What if I told you that the whole point of the stock market is not to make money? What if I told you that the stock market itself is just a Game, and the real object of this Game is not money; it’s the playing of the Game itself?
In The Money Game Adam Smith (also known as George J. W. Goodman) sets out to explain how the stock market is a Game to be played with objectives that oftentimes do not make sense. While money preoccupies so much of our consciousness, The Money Game is adamant that making money is not the real objective of playing the stock market Game. The sooner we realize that the stock market Game is an irrational one, the better we will play it.
Through a series of chapters asking questions and describing real events and real characters (real but masked), George J. W. Goodman sets out to explore the unexplored area of the markets … the emotional area. As he states very eloquently in Chapter 2, “There are fundamentals in the marketplace, but the unexplored area is the emotional area. All charts and breadth indicators and technical palaver are the statistician’s attempts to describe an emotional state.
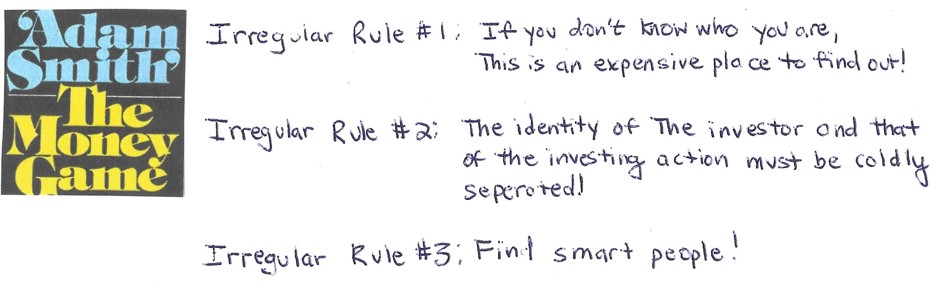
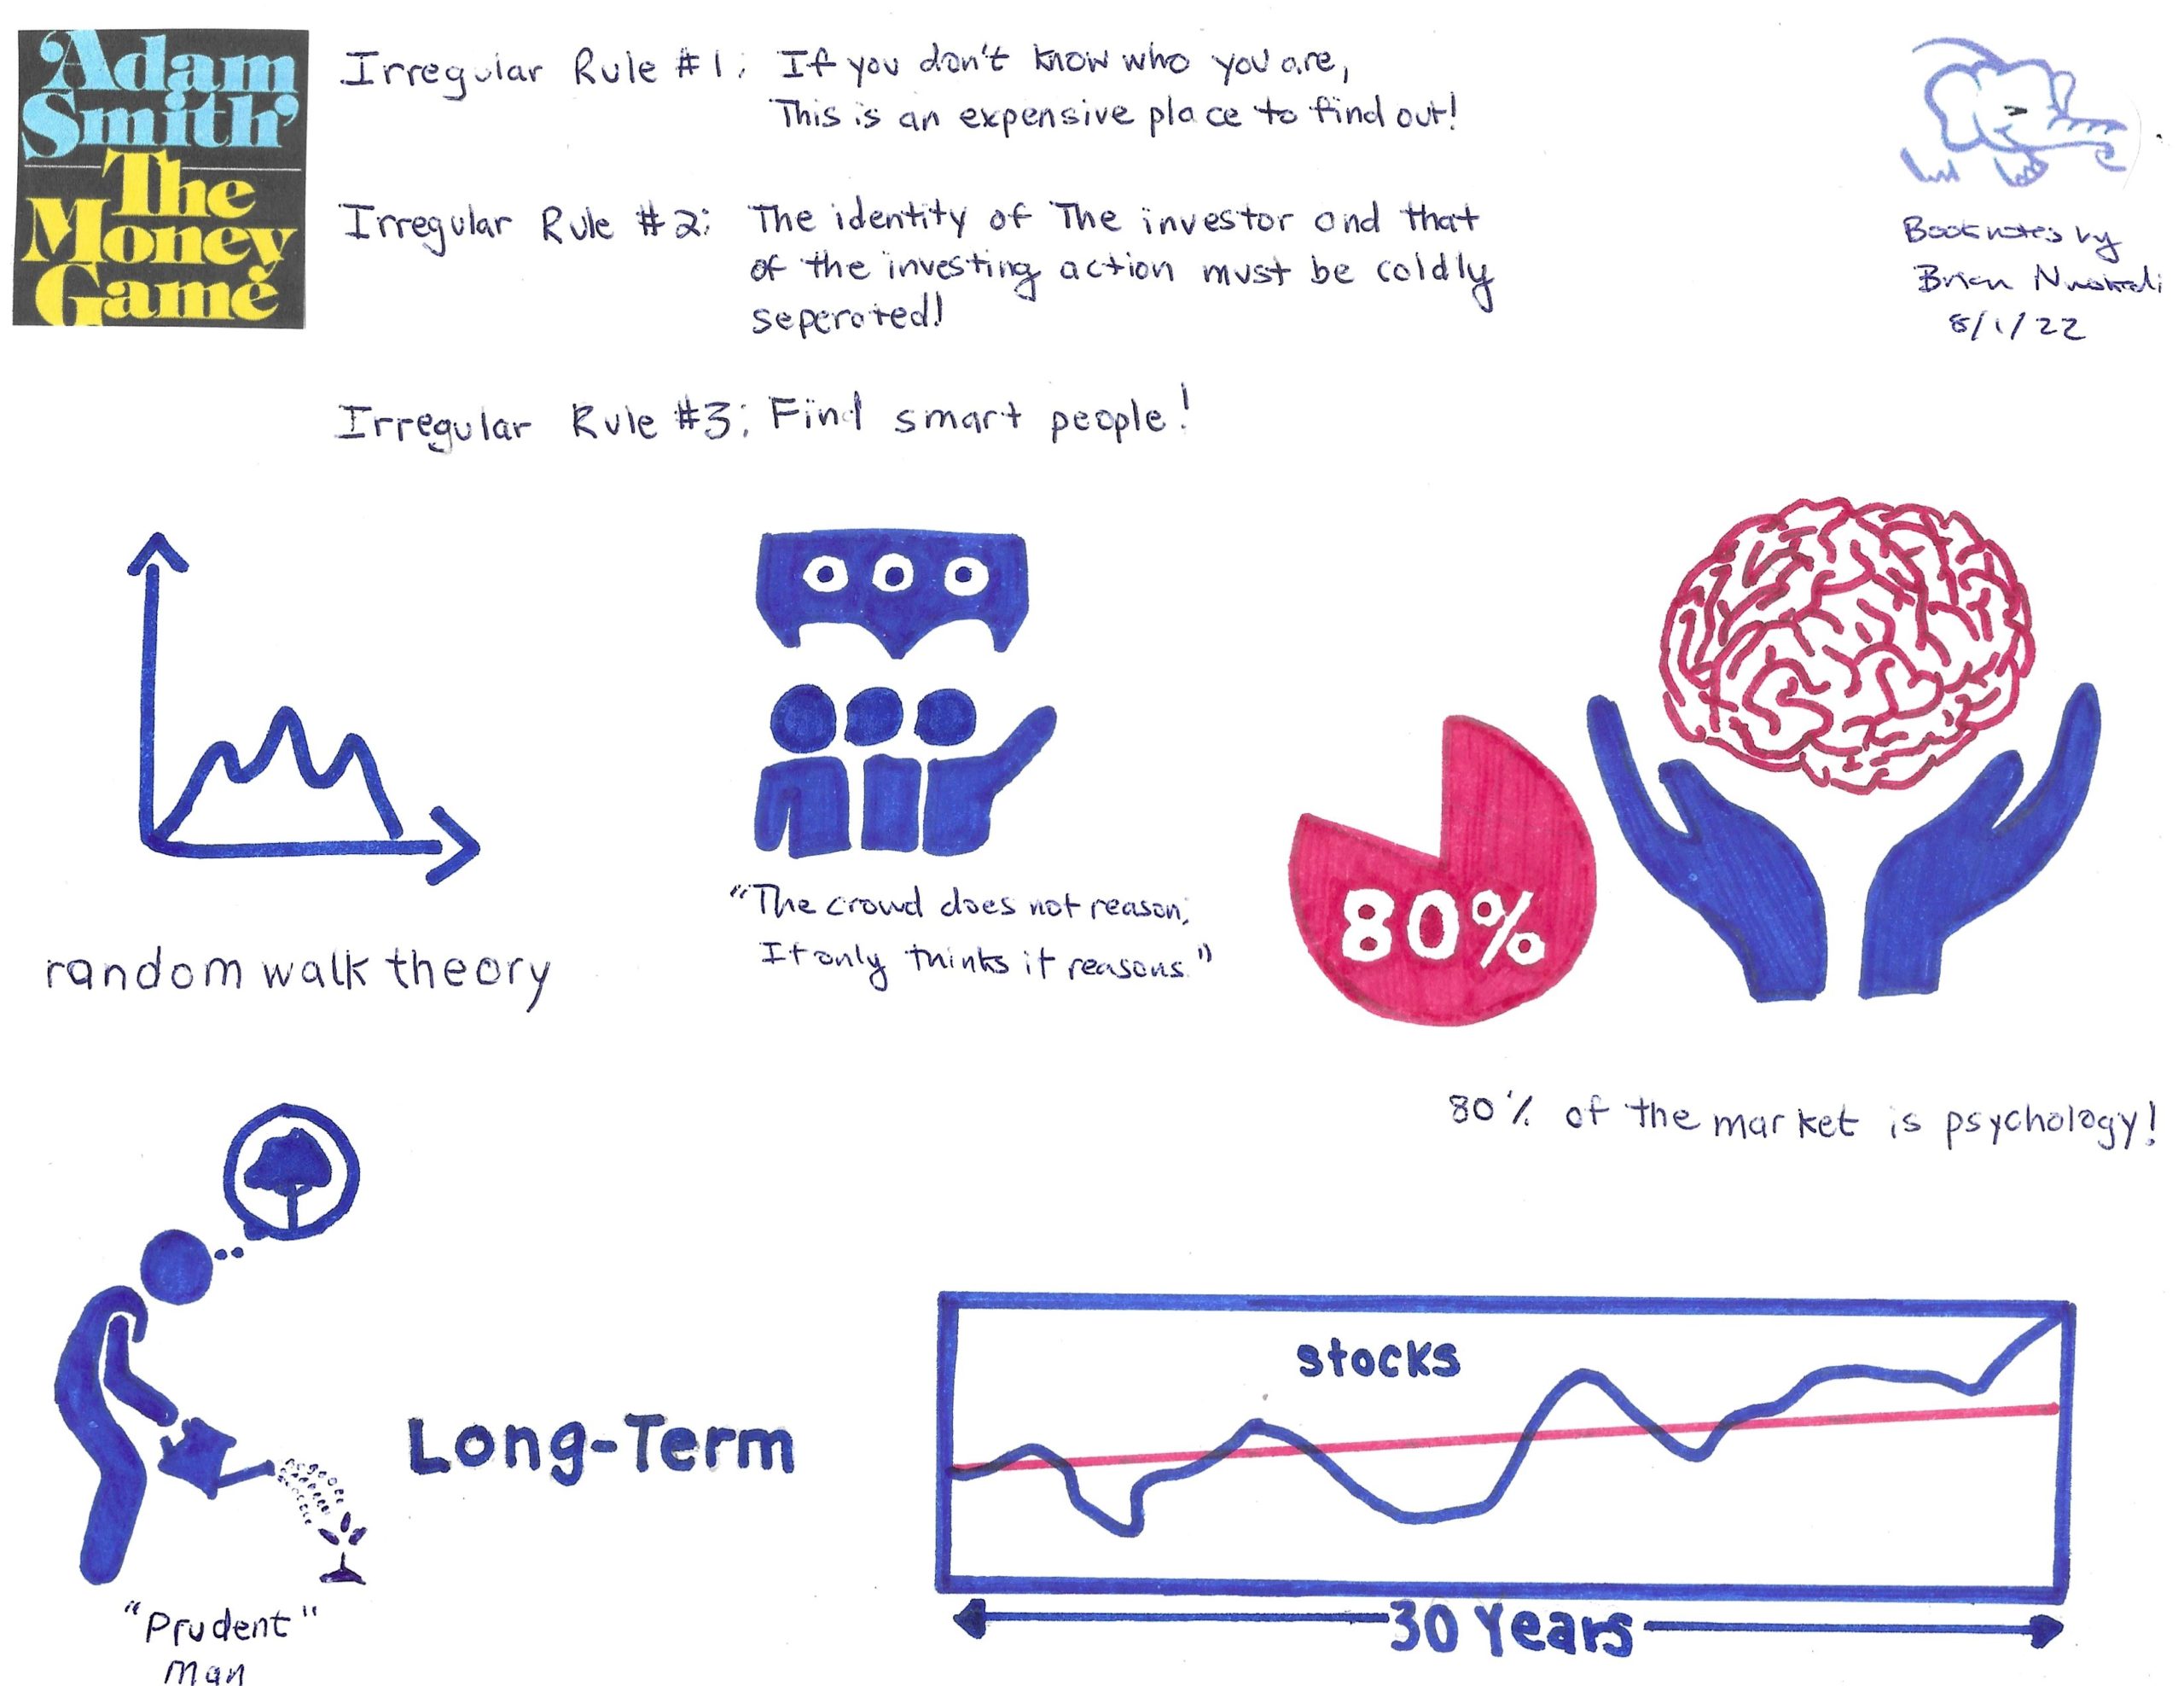
In the end, the one requirement to win The Money Game is to remember the Irregular Rule: If you don’t know who you are, this is an expensive place to find out. Emotional maturity must be displayed over the long run if you are going to survive the game called the stock market.
My Summary Conclusions from Each Chapter
Part I. YOU: Identity, Anxiety, Money: Chapter 1-9
Preface: The game we create with it is an irrational one, and we play it better when we realize that, even as we try to bring rationality to it.
• Chapter 1: The word game was deliberately chosen to describe the stock market and the sooner that all of us small investors understand that this is a game, the better off we may be.
• Chapter 2: Do not forget the Irregular Rule: If you don’t know who you are, this is an expensive place to find out!
• Chapter 3: It all comes back to the Irregular Rule that you must know yourself for the stock market is an expensive place to find that out. The requirement to win this game is emotional maturity.
• Chapter 4: Since 80% of the market is psychology or deeper still human emotionality, the market can really be seen as a crowd. Because of this tendency, there is no substitute for good information, good research, and good ideas.
• Chapter 5: On one hand you have Adam Smith the father of modern economics stating definitely that money is about the maximization of profit and in some sense the accumulation of wealth (i,e. The Wealth of Nations). On the other hand, you have Norman Brown who sees money as a noose around our necks that ultimately makes our human nature impoverished. You must decide for yourself!
• Chapter 6: There are countless reasons people get into the Game. Some people love to gamble and lose. Others just want to make money over the long term by owning stocks forever. Regardless of your reason, you need to know yourself and stick to your plans.
• Chapter 7: The only real protection against all the ups and downs of the market (the anxiety) is to have an identity so firm it is not influenced by all the brouhaha in the marketplace. And remember, the stock doesn’t know you own it!
• Chapter 8: So if we are talking about real big money, forget the stock market. Build a company and have the market capitalize on your earnings.
• Chapter 9: The “simple equation of wealth”: To get rich, you find a stock whose _ has been compounding at a very fat, and then the stock zooms, and there you are.
Part II. IT: Systems: Chapter 10-14
Chapter 10: Charting assumes that what was true yesterday will also be true tomorrow. But you and I know that past patterns/performance are not predictive of future patterns/performance.
• Chapter 11: To quote Professor Fama, “the history of the series of stock price changes cannot be used to predict the future in any meaningful way. The future path of the price level of security is no more predictable than the path of a series of cumulated random numbers. If the random walk is indeed Truth, then all charts and most investment advice have the value of zero, and that is going to affect the rules of the Game.
• Chapter 12: The Game is such that computers take away any long-term advantages individuals find. Our only chance is to rely on luck (random walk thesis).
• Chapter 13: The numbers created by “independent auditors” should be looked at with a grain of salt given that the accountants are paid and hired by the companies themselves.
• Chapter 14: Someone has to be on the losing end of the transaction and that is usually the little investor.
Part III. THEY: The Pros: Chapter 15-18
Chapter 15: Professional investors are “performance” managers who are focused on driving results in the short term. Very few “performance” managers think in the long term. It’s all about driving big capital gains!
• Chapter 16: Like everything in life, those that are really in the know!
• Chapter 17: The market does not follow logic, it follows some mysterious tide of mass psychology.
• Chapter 18: If you are in the right thing at the wrong time, you may be right but have a long wait; at least you are better off than coming late to the party.
Part IV. VISIONS OF THE APOCALYPSE: Can it All Come Tumbling Down? Chapter 19-20
Chapter 19: Sooner or later you have to come to reality, and stop being a father to the world. Lead it, yes. Buy it. No.
• Chapter 20: Sure, it can all come tumbling down. All it takes is for belief to go away!
Part V. VISIONS OF THE MILLENNIUM: Do You Really Want to Be Rich?
Chapter 21: You need to create your own money philosophy to answer the question do you really want to be rich?
Visual Summary of Key Findings from Book
“Unfortunately, as we have seen, the playing of the Game is not entirely a rational affair. There is nothing so disastrous, said Lord Keynes as a rational investment policy in an irrational world”
Having finished the 750+ page tome to Capital by Thomas Piketty well over a year ago, I have just gotten around to writing up what I learned. In attempting to summarize this book, I realize that there is no way I can cover everything I learned. Quite simply, Piketty has blown my mind with the depths of his research. This book is the deepest source I have ever read on how capital behaves and why wealth and income inequality are two sides of different coins.
I figure that the best approach with this write-up is to break it down into manageable chunks. What follows below is a summary of the theoretical characteristics of Capital and how it behaves in the world today as well as in the past. I’ll unpack the features of income, capital, and output and how each of these dynamics interplay with one another.
The next write-up at a later date yet to be determined, will delve into the impacts that Capital has had on inequality. I’ll unpack the structure of inequality and some potential solutions that Piketty mentions. This review is by no means a political or opinion piece. I am simply sharing some of the learnings I received from diving into this book.
With that, let’s dive in…
Is r > g the Central Contradiction of Capitalism?
The first concept that Piketty spends time unpacking is the relationship between returns on capital and the overall growth rate of the economy. Piketty boldly states that growth in the future will slow and capital will be that much more important. As economic growth slows and falls below the average rate of return on capital, past wealth naturally takes on a larger importance. This is simply because it takes only a small flow of new savings to increase the stock of wealth steadily.
Thomas Piketty’s First Fundamental Law of Capitalism
The second concept that Piketty spends time unpacking is what he calls his First Fundamental Law of Capitalism. This law shows how important capital is in relation to the national income of a country. As the nature of wealth over the long run continues to transform (i.e., capital used to be agricultural and has since been replaced by industrial, financial capital, and urban real estate), its importance as measured by the capital/income ratio has remained steady and unchanged.
Thomas Piketty’s Second Fundamental Law of Capitalism
The third concept that Piketty spends time unpacking is what he calls his Second Fundamental Law of Capitalism. This law shows that countries with high savings rates and low growth rates accumulate enormous stocks of capital relative to their incomes over the long run. This can have significant effects on the social structure and distribution of wealth in a country. Piketty emphasizes that the impacts of this law are gradual and take decades to manifest. Boldly, Piketty predicts that by 2100 the entire planet could look like Europe at the turn of the 20th century with a capital/income ratio of 6-7 years.
The Dynamics of the Capital/Income Ratio in Europe and the U.S.
By investigating the dynamics of the capital/income ratio of Britain, France, Germany, and the United States, Piketty uncovers that the nature of capital in these rich countries has changed: capital was once mainly land but has now primarily become housing, industrial, and financial assets. But capital’s importance remains the same.
The Dynamics of the Capital/Income Ratio in Britain
In Britain, private wealth in 2010 accounted for 99% of national wealth and the bulk of the pubic debt in practice was owned by a minority of the population. Britain in summary is a country with accumulated capital based on public debt and the reinforcement of private capital.
The Dynamics of the Capital/Income Ratio in France
In France, private wealth in 2010 accounted for 95% of national wealth and the bulk of wealth in France was driven by accumulations of significant public assets in the industrial and financial sectors followed by major waves of privatization of these same assets. In a sense, France is a country with a model of Capitalism without Capitalists.
The Dynamics of the Capital/Income Ratio in Germany
In Germany, capitalism takes on a more social ownership point of view. Prevalent in the German marketplace is the stakeholder model of business where firms are owned not only by shareholders but also by certain other interested parties like the firms’ workers themselves. This Rhenish Capitalism has resulted in lower stock market valuations for German firms when compared to British & French firms.
The Dynamics of the Capital/Income Ratio in the United States
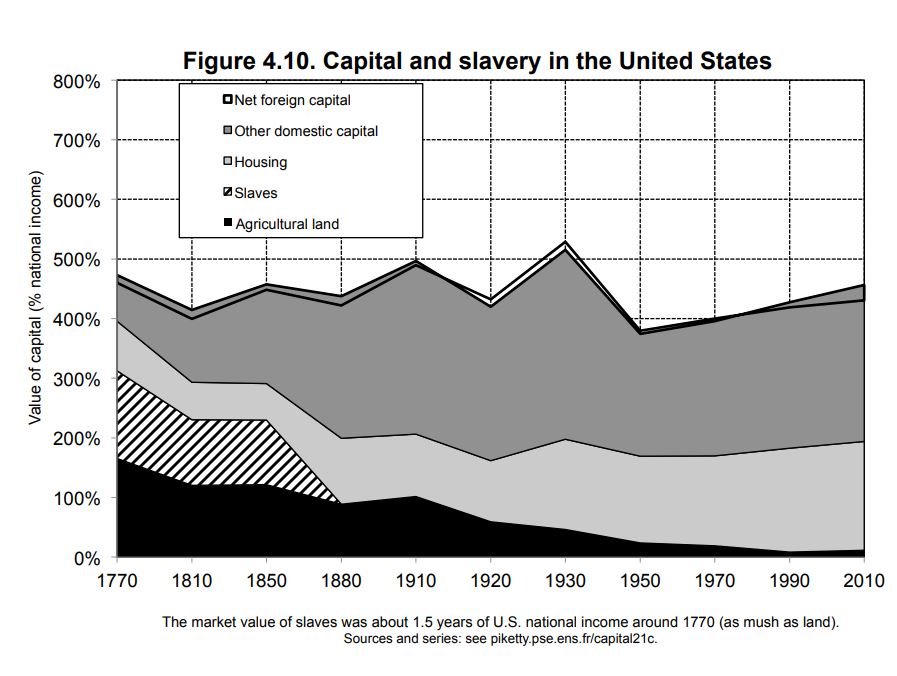
In the United States, more than 95% of the assets are American-owned but the influence of landlords and historically accumulated wealth was less important in the U.S. than in Europe. However, the structure of capital in the United States took on a different form. Specifically in the South, slave capital largely supplanted and surpassed landed capital. So much so, that the total market value of slaves represented nearly a year and a half of U.S. national income in the late 18th and first half of the 19th century.
Conclusion
A market economy based on private property, if left to itself, contains power forces of divergence, which are potentially threatening to democratic societies and to the values of social justice on which they are based. My next write-up on Capital in the Twenty-First Century by Thomas Piketty will dive into the immense inequalities of wealth that have occurred as a result of the natural dynamics of capital.
Purpose of this article: (1) to show the average retail markup on Green Smoothies and Clean Juices, (2) a solution to save money by making these items at home, and (3) the financial decision making concept of payback period.
Overview
About a year and a half ago I go a NutriBullet PRO, and like most gifts like this, I planned to make the “most out of it”. Unfortunately much like my Latte Habit, I continued to buy store made smoothies from the variety of shops we have here in Charlotte.
Fast forward to 2020, and the resulting shutdown due to COVID-19, and store bought smoothies suddenly became obsolete. Life has a funny way of sometimes making and/or forcing you to appreciate the things you have. And the global pandemic did exactly that for my NutriBullet PRO.
Since pretty much the start of lockdown in March of 2020, my wife and I have adopted a daily Green Smoothie habit; brought to us by none other than the same NutriBullet PRO that originally sat in the kitchen pantry gathering dust. What started as a simple trial has now blossomed into a daily enterprise of good health decisions: (1) a daily green smoothie from our NutriBullet followed by (2) a clean juice from our Aicok Juicer:
The following is my attempt to calculate the financial benefits that have accrued to us as a result of switching to home made green smoothies and clean juice.
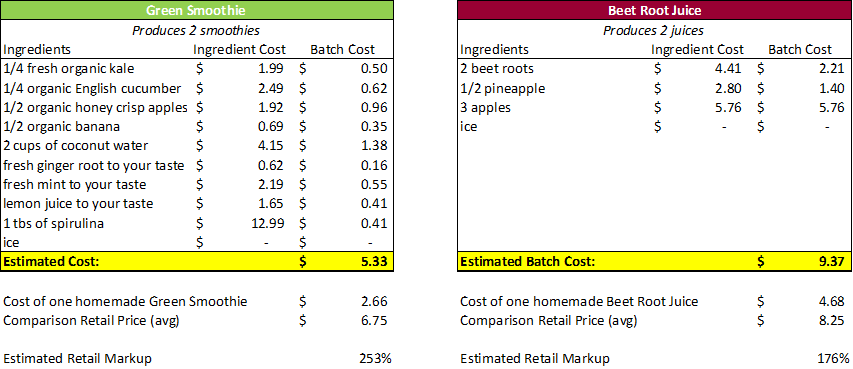
EstimatedCost of a Homemade Green Smoothie & Juice
Our two go-to recipes for green smoothies and clean juice are as follows:
Using the menu of one of my favorite smoothie and juice establishments here in Charlotte I get an average retail price of $6.75 and $8.25 for smoothies and juices respectively. This represents a markup of +176% to $253% on average!!!
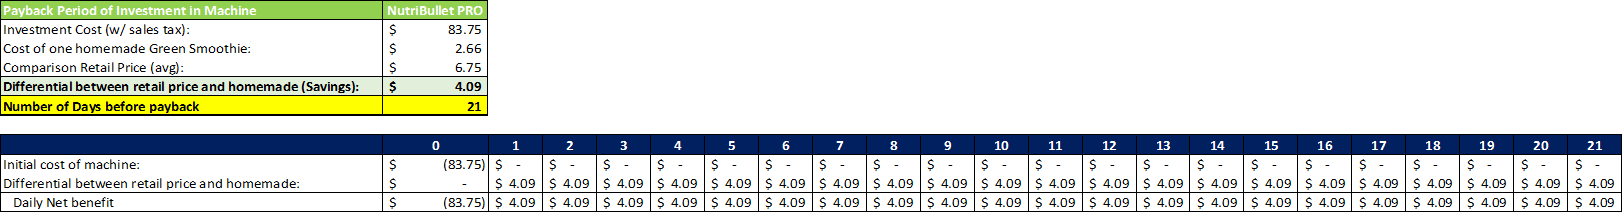
Use the Concept of Payback Period to Evaluate
When deciding whether or not to buy a new machine for our house, analyzing the payback period can be an effective financial decision making tool. Most of the time when considering such investments or purchase decisions, the time value of money should be applied to your analysis. This simply means that you should consider the fact that your money today is worth more than that same sum of money in the future due to the fact that your money today can earn interest or a return.
Sometimes though when the investment decision is simple and involves relatively smaller sums of money, analysis of the payback period can be a suitable alternative. The payback period is the amount of time it takes you to recover the initial cost of an investment or purchase. You calculate this by dividing the amount of the original investment by the annual cash flow or net benefit (in the case of my green smoothie/juice machines) derived from the investment.
Using the concept of payback period, lets analyze my Green Smoothie and Juice Machines:
Besides the obvious health benefits of our daily Green Smoothie and Clean Juice habit, the financial implications are immense. After investing in a NutriBullet Pro, it will take roughly 21 days of Green Smoothies to payback the cost of the machine.
By contrast yet still positive, after investing in an Aicok Juicer, it will take roughly 47 days of Clean Juices to payback the cost of the machine.
There is just no denying how value add both machines have been to our lives both from a health standpoint and a financial standpoint. It’s a no brainer given how quickly both machines payback the original cost when compared to purchasing these items at retail stores.
Purpose of this article: to share a contrarian investment approach with consistent results that speak for themselves.
Bullet Point Summary
The Golden Butterfly Portfolio is built as an extension of the Permanent Portfolio
The Permanent Portfolio selects assets that perform in four distinct economic realities:
Choose stocksto capture returns during economic Prosperity
Choose cash & short-term treasuries to capture returns during economic Recession
Choose gold to capture returns during periods of economic Inflation
Chooselong-term treasuriesto capture returns during periods of economic Deflation
The Golden Butterfly Portfolio is more aggressive than the Permanent Portfolio with a higher allocation placed in stocks.
This portfolio protects you and grows your money regardless of what happens in the general global economy and it may be perfect for the “set it and forget it” investor.
Overview
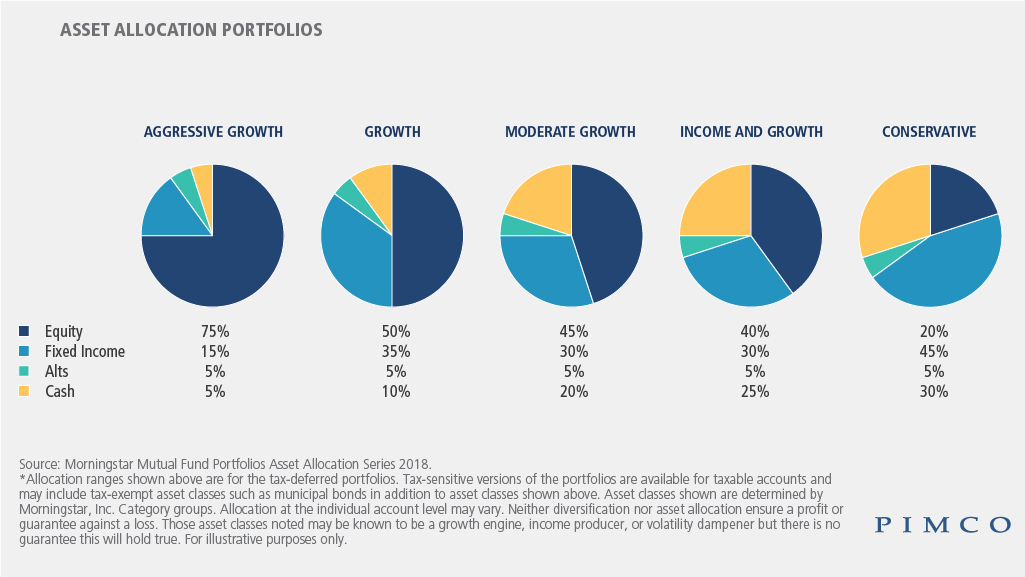
Whether you are a seasoned investor or new to investing, choosing the way you divide your investment up can be a daunting task. Google the word “asset allocation” and you will get over 164 million results. As shown in the following graphic from PIMCO Investment Management, there are five traditional methods to allocate your investments across different assets:
Building the right portfolio to capture long-term returns can feel like an endless exercise in futility. Some of us go at this alone, while others of us leverage money managers and investment advisors. Regardless of the approach, we all hope to end up with enough investment returns to retire comfortably. My hope with this article is to offer you a new and simple asset allocation that helps you set your investments and forget them until retirement.
What Is The Golden Butterfly Portfolio?
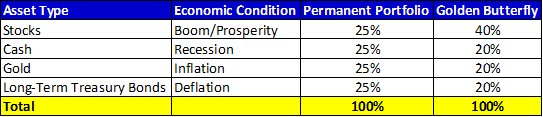
In 1998, Harry Browne wrote Fail-Safe Investing where he spelled out his principles for the “Permanent Portfolio.” The underlying thesis to his approach was that four economic conditions have historically occurred at varying frequencies throughout the years. By allocating investments in equal weights across stocks, bonds, cash, and gold, Browne theorized that his Permanent Portfolio would perform well regardless of the changing economic conditions.
The Golden Butterfly is essentially a more aggressive version of Browne’s Permanent Portfolio. Under the Golden Butterfly Portfolio, the exposure to stocks is increased from 25% to 40% while the exposure to Treasury bonds, cash, and gold are reduced from 25% to 20% respectively. The following chart details the differences between the Permanent Portfolio and the Golden Butterfly Portfolio:
By allocating your investments this way, you can take a more neutral outlook on a given economic condition. This investment approach grows your money no matter way the future holds.
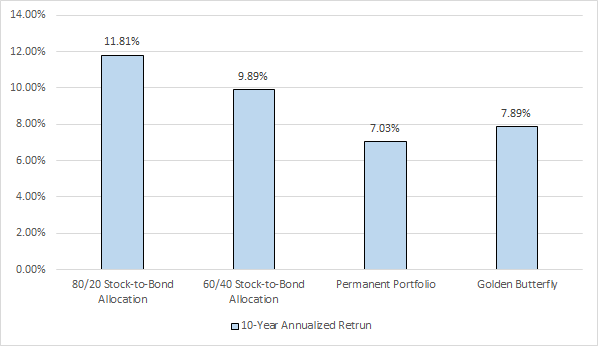
How Does The Golden Butterfly Portfolio Stack Up Over Time?
The following performance comparison is through September 30, 2020:
As you can see from the above, the clear winner has been the 80/20 stock-to-bond allocation which returned +11.81% over the last 10 years. But it is important to note that over the past 10 years, the economic conditions have been categorically Boom/Prosperity and the stock market has been on an unprecedented run. Thus portfolios with more exposure to stocks have done better over the past 10 years, than portfolios with less exposure to stocks.
Both the 80/20 stock-to-bond allocation and the 60/40 stock-to-bond allocations have more stock exposure than the Permanent Portfolio (only has 25% stock exposure) and the Golden Butterfly Portfolio (only has 40% stock exposure). And as such, they have performed better overall than both of those portfolios. It’s important to note though that investing in stocks carries more risk than investing in bonds or gold.
By investing in the Golden Butterfly Portfolio, you are giving yourself a chance to grow your money as seen in the +7.89% over the past 10 years. And you are doing so in a less risky fashion since only 40% of your portfolio is exposed to stocks. The downside though is in Boom/Prosperity economic conditions, the Golden Butterfly Portfolio underperforms other portfolios with more stock exposure as shown in the graph above.
What is Right for You?
As I mentioned in the beginning of this write up building the right portfolio to capture long-term returns can feel like an endless exercise in futility. But only if you lose site of what you are trying to accomplish. Investors that are interested in setting a portfolio that grows their money while mitigating overall risk will be very interested in the Golden Butterfly portfolio.
While this portfolio sacrifices a lot of the upside of other more aggressive portfolios, it’s simplicity for the average investor or beginning investor outweighs this fact. You should heavily consider investing in the Golden Butterfly Portfolio if you are looking for an asset allocation that is simple and effective at growing your money over the long-term while allowing you to not worry about specific economic conditions.
The Extras…
Here is video on how exactly you can build the Golden Butterfly using index funds.
Purpose of this article: to help you quickly create and monitor your personal balance sheet.
Bullet Point Summary
Before you can improve your current financial situation you need to figure out where you are. The personal balance sheet is a great tool to help you accomplish this.
Personal Capital is my favorite personal finance app and piece of software to show net worth. It will speed up the gathering of your financial information, and will give you an awesome snapshot of your net worth every time you log in.
The personal balance sheet gives you a better view of your total finance picture, better than a budget or net cash flow spreadsheet.
Overview
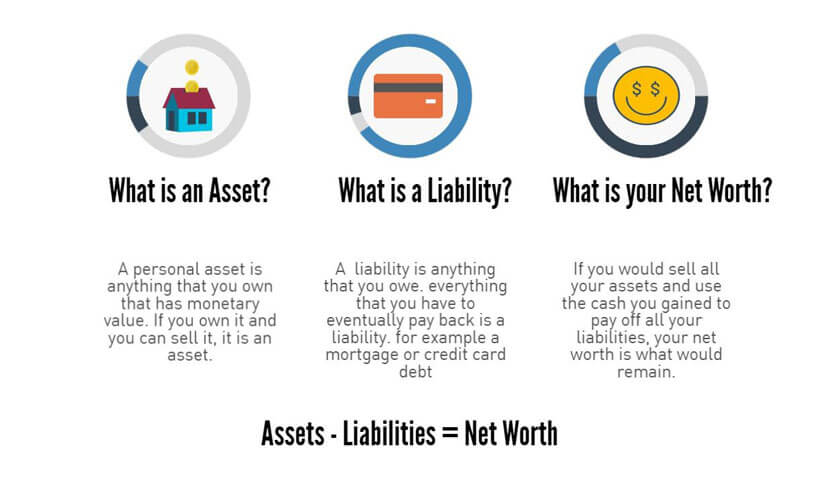
A personal balance sheet provides an overall snapshot of your net worth (or net wealth) at a specific period in time. It is a summary of your assets (what you own), your liabilities (what you owe) and your net worth (assets minus liabilities). The old business adage “what gets measured, gets managed” rings true in your personal finances as well. Without a personal balance sheet, it becomes very challenging to put forth effective short-term and long-term strategies to improve your finances.
Gathering the Necessary Data
Compiling the necessary financial information to create your personal balance sheet can be an arduous manual process especially if you are not using personal finance software like Mint or Personal Capital. So if you do at least one thing after reading this, start using some personal finance software today! Here is a link to reviews on some of the best personal finance software.
There are a ton of reviews comparing all of the ins and outs of each of the different personal finance apps and software, but my favorite by far is Personal Capital. In short, Personal Capital gives you the best view of your Net Worth, and does this quickly, accurately, and in real-time. Additionally, Personal Capital utilizes Yodlee to sync up to your various financial accounts, and thus has fewer reported sync issues.
It’s not a budgeting tool like YNAB or Mint, and it doesn’t help much with daily cash management (i.e. managing expenses, paying bills, alerts on overspend, etc.). It is though an effective aggregator that can help you manage your short-term and long-term views of your net worth.
Create Your Personal Balance Sheet
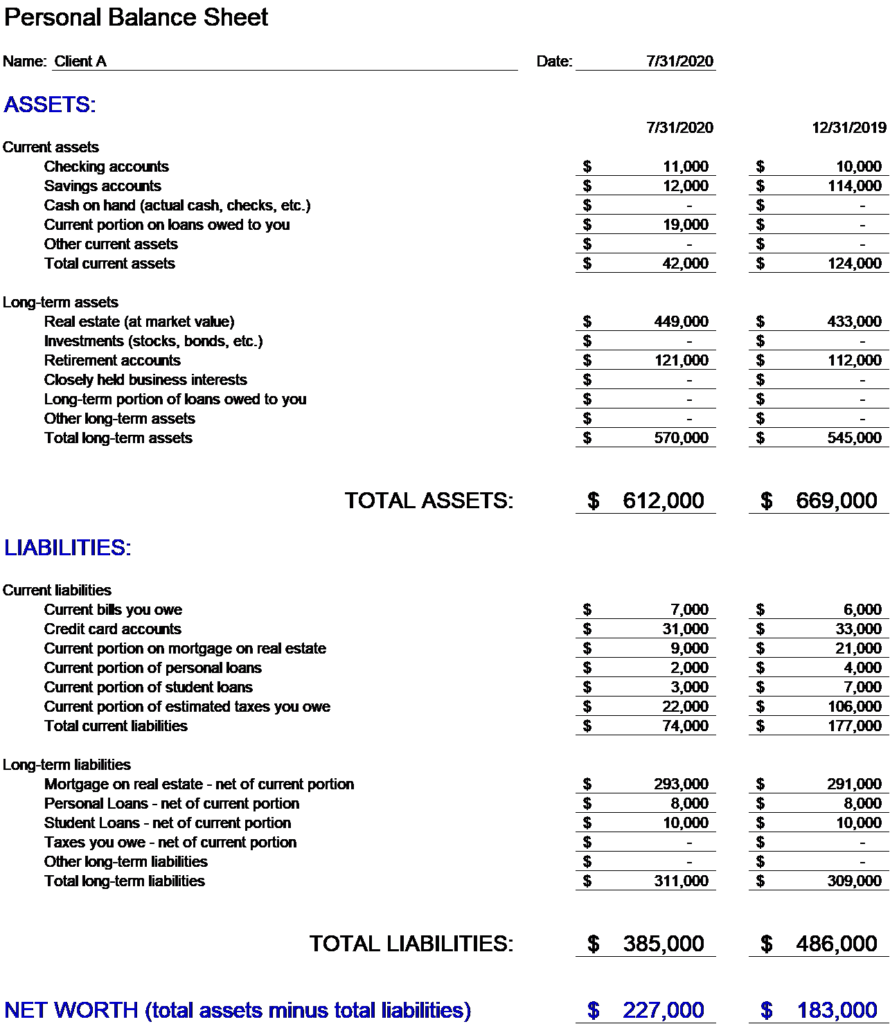
Using Personal Capital, the following personal balance sheet was created for Client A in less than 10 minutes:
All of the values for assets and liabilities are from the same day and thus reflect the same, single point in time for my client’s finances.
What Does It Actually Mean?
Now take a closer look at each column. Over the past seven months there has been a +24% increase in net worth as Client A’s net worth has grown from $183K to $227K. Back in December of 2019, the comprehensive financial strategy that was put in place focused on building retirement assets while steadily paying down liabilities owed, and thus far into the year this strategy is working for Client A.
In general, there isn’t really a magical solution that quickly changes one’s net worth position. Consistently executing your financial plan which usually entails some combination of savings, investing, and paying down debt is the tried and true strategy to increasing your net worth.
But before you can improve your financial situation, you need to measure your current starting point. The personal balance sheet is the best tool to help you do just that, and utilizing the financial app, Personal Capital, makes the compiling and tracking of this information seamless.
Purpose of this article: to define the emergency fund and help you put together a plan to increase yours.
Bullet Point Summary
Building an emergency fund to cover 3-12 months of expenses will take time
Focus first on saving $1,000 as soon as possible
Commit to saving all windfall payments you receive like tax refunds or any year-end company bonuses
Over the long-term you will need to spend less to save more and look to make more income overall
Building a good budget that helps you cut back on spending will be key
Save any yearly raise received. 1% to 3% can add up quickly
Rinse and repeat until you hit your goal
Overview
Ask any financial planner and they will tell you that an emergency fund is a must. Some will suggest you save upwards of three months of expenses while others will tell you one full year. In this article we discuss the ins and outs of the emergency fund and conclude by giving you strategies to boost your emergency funds.
What Are Emergency Funds For?
The ultimate point of the emergency fund is to set aside cash to cover your most basic needs during an unexpected life event. We all have differing wants and desires in life, but our basic biological requirements for survival are the same. When push comes to shove, we need air to breathe, food and drink, a place to lay our heads at night, and clothes to wear, as depicted in Maslow’s Hierarchy of Needs:
Maslow’s Hierarchy of Needs
Consequently, an emergency fund needs to be established to cover unexpected financial situations like the eviction from an apartment, loss of a job, medical bill, or temporary disability to name a few. In these situations, you’ll need immediate access to cash to cover your most basic expenses and needs while you get your financial situation back on track.
Is There a Right Number?
In a 2018 article, CNBC found that only 39% of Americans had enough savings to cover an $1,000 emergency. Defining the “right number” for an emergency fund is hard because financial emergencies by their very nature are unplanned and their lengths unknown. Instead, we suggest thinking through some of the larger types of unexpected life events that could cause you to dip into your emergency fund and planning specifically for those:
Loss of steady income from primary job – it takes roughly one month per $10,000 you make to find job per thebalancecareers.com. So a person making $50,000 a year would need at least five months of income saved up (roughly $21,000) to tidy themselves during their job hunt.
Car repairs and maintenance – depending on the severity of repair, costs can range from $300 for a water pump replacement up to $3,000 for a transmission replacement.
Major household repairs – similar to car repairs the cost of household repairs will very with the severity of the repair. An new HVAC system can cost 3,800+ while a new roof can run into the tens of thousands.
Using these four large unplanned expense, we build the following table to give you suggested savings targets at differing levels of income:
These savings targets are simply estimates and provide months of coverage ranging from 6 to 12 months. The most important thing is for you to see how expensive unplanned emergencies can be and start actively saving for them.
Short-Term Steps to Build Your Emergency Fund Over Time
It will take time to build a robust emergency fund with three to twelve months of expenses. With competing interests like saving for retirement and paying down debt, it can be difficult to find the extra cash needed to build your emergency fund. The following are the first couple of steps you can take in the short-term that will allow you to build temporary cushion for emergencies.
Your first step will be to save $1,000 as soon as possible. As we mentioned above, only 39% of Americans had enough savings to cover an $1,000 emergency. By focusing here, you are giving yourself a tangible goal that will help give you real cushion against any financial emergencies in the short-term. Set up an automatic transfer from your checking account to an online savings account like Ally of at least 3% of each paycheck. Someone making $40,000 would have over $1,000 in one year:
This assumes that your emergency fund doesn’t accrue any interest which isn’t the case especially if you put your funds in an Ally online savings account. As of the date of this article 5/22/19 Ally’s interest rate on their online savings account was 2.20%.
Your second step will be to save all windfall payments you receive like tax refunds or any year-end company bonuses you may receive. In the past tax refunds had averaged close to $2,100, but this year that was down to about $1,950. Even still, you should put this injection of cash directly into your emergency fund and get one step closer to peace of mind.
These steps are meant to help you build a temporary cushion for emergencies in a short amount of time. Once you complete these steps you will switch your focus to paying down debt if you are not debt-free. And once you are debt-free you will refocus on aggressively building a more robust and complete rainy day fund to cover three to twelve months of expenses.
Long-Term Steps to Build Your Emergency Fund Over Time
It will take time to build a robust emergency fund with three to twelve months of expenses. You should view view building enough emergency savings as a long-term project that will get easier as you free up more cash from the burden of life’s expenses.
Over the long run it will be important that you do two things very well: (1) spend less to save more and (2) make more income. As simple as this may seem, these two factors are the key to building your emergency fund in the long-run.
In order to spend less you will need to build a good budget that helps you cut back on spending. Knowing exactly how much you spend monthly will be key and we suggest using a digital app like Mint or You Need A Budget to track your expenses. The ultimate goal is to bring light to your monthly cash inflows and outflows which will help you free up funds to accelerate the growth in your cash reserves.
Boost your savings by bringing in more income through a side hustle or part-time job even if only temporarily. Make sure to save any yearly raises received. The average pay raise is around 3%, so a person making $40,000 would have an additional $1,200 to save towards the emergency fund over the next year.
Continue to execute the short-term and longer-term strategies discussed above until you hit your goal of three to twelve months of emergency savings.
Conclusion: Remember It Takes Time
An estimated 530,000 families go bankrupt each year because of medical issues, so it’s clear that medical expenses are a big unplanned life event. On top of unplanned medical expenses, there are a ton of other life events that happen unexpectedly that can derail your longer-term financial plans.
The only way to ensure that you will be truly financially secure in times of crisis is to build a robust and well-padded emergency fund. It takes some real time and effort to build a robust enough emergency fund that can handle three to twelve months of expenses, but it’s absolutely doable. We hope the strategies detailed within this article will give you a good enough guide to start building your emergency fund.
Purpose of this article: to convince you that a switch to passive investing will boost your chances of hitting your long-term investing and wealth generating goals
Bullet Point Summary
Since 1926 the entire gain in the U.S. stock market is attributable to just 4% of stocks.
Well over 40% of stocks generated 0% return since 1989 and underperformed even Treasury Bills.
To top this off, the top 86 stocks have created 50% of the total $32 trillion generated in the stock market from 1926 to 2015.
These improbable sounding stats point to a mathematical principle called Positive Skew, which ensures that only a handful of active investors will pick and own the right stocks that turn into big winners.
The Positive Skew of stock market returns ensures there will always be more losers than winners.
Consequently, switching to passive investing and indexing is the only tangible and consistent solution to combating the dynamic of Positive Skew.
Overview
I consider myself an educated investor that at best can generate okay to modest returns on average. Even though I take the time to evaluate individual stocks, invest in companies at “the right” price point, and hold for the long-term, I can’t consistently generate over-the-top returns in my active portfolio. And neither can many of my smart counterparts on Wall Street with their enormous informational and financial resources.
Inherently I have always known that trying to beat the market is a fool’s errand. And while books like Fooled by Randomness and A Random Walk Down Wall Street remind me of the difficulties of consistently besting the market, it was an article on Bloomberg I recently read that put the nail in the coffin of active investing for me.
The thesis of the article is very simple:
Not only can’t humans outdo benchmarks, we can’t even fight them to a draw.
Why Do We Suck So Hard at Consistently Picking Winners?
While it is important for active investors to do their homework when it comes to compiling an investment strategy the actual reality of the stock market is that all this effort is futile. When push comes to shove the fundamental reason why active investing sucks so hard is that the distribution of returns in the stock market is bizarrely lopsided.
Because of the statistical principle of Positive Skew (see picture below), only a handful of active investors will pick and own the right stocks that turn into big winners. The rest of the market simply will not.
By Rodolfo Hermans (Godot) at en.wikipedia. – Own work; transferred from en.wikipedia by Rodolfo Hermans (Godot)., CC BY-SA 3.0, https://commons.wikimedia.org/w/index.php?curid=4567445
The Positive Skew of stock market returns means that there will always be more losers on the left side of the distribution than winners who end up on the right side of the distribution with better than average returns.
History Clearly Shows Stock Picking Losses for Most Active Investors
The math and statistics are simply not in your favor if you are an active investor. The nature of the stock market is such that the odds are stacked against active investors when it comes to consistentlypicking winners. On average, there will be a small number of extreme winners, a small number of extreme losers, and a ton of stocks that will oscillate around average performance. As a result, most everyone outside of an indexer owns mostly deadbeat stocks.
The following chart from A Wealth of Common Sense shows exactly this as well over 40% of stocks generated 0% return since 1989 and underperformed even Treasury Bills.
And in 2017, Hendrik Bessembinder found that since 1926 the entire gain in the U.S. stock market is attributable to just 4% of stocks. And to top this off, he also found that the top 86 stocks created 50% of the total $32 trillion generated in the stock market from 1926 to 2015.
Just stop for a second and let that all sink in… And once you have, call your active money manager and request a change in strategy.
Conclusion: Switch to Passive Investing
For most of us, switching to passive investing and indexing is the only tangible and consistent solution to combating the dynamic of Positive Skew. With active investing comes a much greater chance of underperformance that inherently comes when you attempt to pick stocks. And consequently, active investors need to realize that the statistical disadvantage of Positive Skew is an uphill battle that most of them will lose.
It’s simply impossible to actually know which companies will be the outsized winners (think about trying to place a bet on Amazon and Google circa 1998). The only real option is a diversified passive investment strategy which spreads your investment dollars across a lot of different companies. This simplistic and effective approach is best positioned to beat the statistical dynamic of Positive Skew in the stock market.