
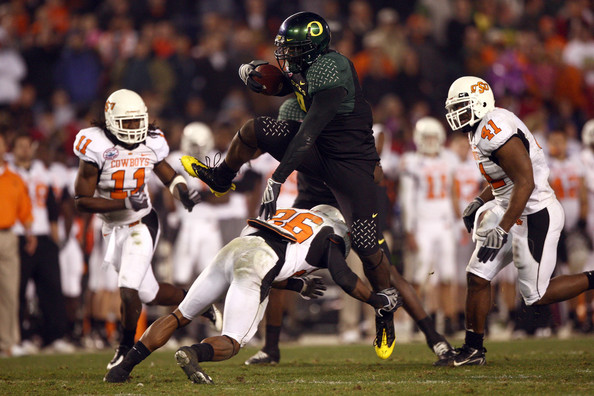
You have probably heard of the old financial axioms, “You have to spend money to make money,”, or “It takes money to make money.” Although we can find examples within our lives that counter this argument, nowhere do these axioms ring truer than in Big-Time college football. On December 30, 2008 in front of 59,106 fans, the 9-3 Oregon Ducks faced off against the 9-3 Oklahoma State Cowboys. In what would be a battle between two newer more financial wealthy programs (I’ll speak about this point shortly) and Oregon Coach Mike Bellotti’s final game, the Ducks beat the Cowboys in a thrilling 42-31 contest.

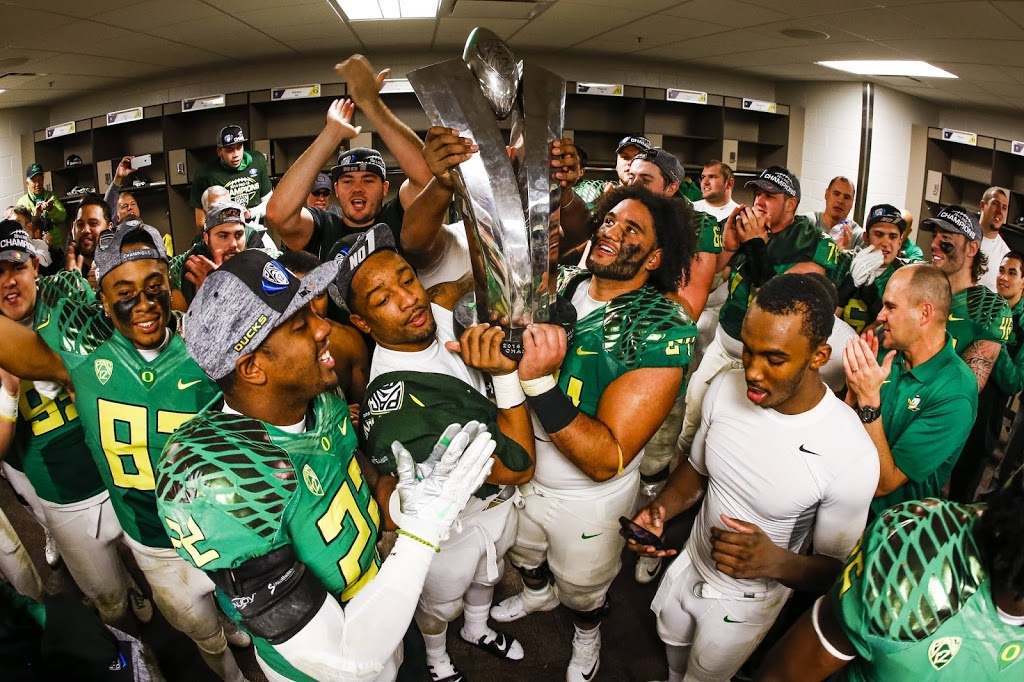
Fast forward to the present, as I sat watching the inaugural College Football Playoff final between Ohio State (old wealth) and Oregon (nouveau riche), I couldn’t help but smile as I watched the Oregon Ducks take the field. Just one week prior to the final, the Ducks played in their 3rd Rose Bowl in six years. And over the last decade, the Oregon Ducks boast a 106-26 record (80.3% win percentage) which is 4th best in college football; they have two national championship appearances, and four conference titles to boot.
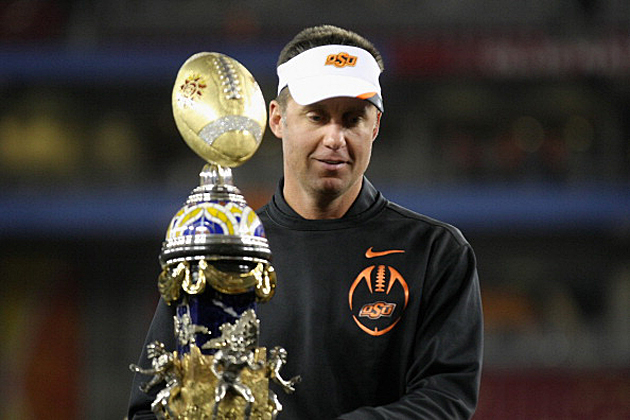
There is absolutely no denying that Oregon’s meteoric rise to the top of college football directly correlates to their colossal increases in football specific spending. Since 2005, the University of Oregon’s Athletic Department’s spending on football specific activities averaged $16.7 million and has grown at a compound annual growth rate of +15.75%. And as mentioned before, during this same time period the Ducks have won four conference titles and have appeared in two national championships. For a school that captured a grand total of three conference titles from 1986 to 2004 this isn’t half bad! During the same time frame, the Oklahoma State University’s Athletic Department’s spending on football specific activities averaged $15.2 million and has grown at a compound annual growth rate of +9.93%. Over the last decade, the Cowboys boast an 83-44 record (65.4% win percentage) during which they also captured one Big XII championship and the 2012 Fiesta Bowl. For a school that captured a grand total of zero conference titles from 1986 to 2004 and boasted a very subpar 102-113 record (47.4% win percentage) things are definitely looking up.
No two nouveau riche programs in college football have had more influential benefactors that these two programs. Phil Knight and T. Boone Pickens have each donated roughly $300 and $400 million to their respective Universities, with $265 million specifically going to the OSU football program. And just last year alone, Phil Knight gifted nearly $100 million to the Ducks and a new training facility for the football team[1]. Given these very large financial contributions, I want to take a look at the financial data and compare the investments to wins and losses on the field. My argument here is actually quite simple: Oklahoma State and Oregon’s success is due in large part to the funding received from T. Boone Pickens and Phil Knight. The excessive levels of cash have transformed both of these programs into perennial powers that are here to stay, and the data will show how much.
Using a regression based analysis and looking at the financial data for the Oklahoma State and Oregon athletic departments since 2008 I focused on comparing wins-losses to the following five crucial variables for each program:
(1) Football Specific Contributions: money contributed by donors/benefactors designated to be use only for the football program.
(2) Non-Program Specific Donations: money contributed by donors/benefactors designated to be used for any athletic program
(3) Football Specific Expenses: money spent by the athletic department specifically on football activities.
(4) Non-Sport Specific Expenses: money spent by the athletic department on activities across all sports at the universities
(5) Marketing and Fund Raising Expenses: money spent on marketing initiatives to raise brand awareness for the universities’ athletic programs.
When considering financial investments in football, it is my opinion that the above mentioned five variables are the most directly correlated to wins and losses on the gridiron, and the data proves this point to a tee.
Looking at the regression outputs for wins for Oregon and Oklahoma State (see bottom of page for output), the Ducks have an R-squared of 95.8% and the Cowboys have an R-squared of 89.5%. What this means is that the financial data I selected (the five variables above) explains 95.8% of the variation in Oregon’s wins and 89.5% of the variation in Oklahoma State’s wins. Looking at the regression outputs for losses for Oregon and Oklahoma (see bottom of page for output), the Ducks have an R-squared of 88.7% and the Cowboys have an R-squared of 86.1%. What this means is that the financial data I selected (the five variables above) explains 88.7% of the variation in Oregon’s losses and 86.1% of the variation in Oklahoma State’s losses. Put even simpler than all of the above … Oregon and Oklahoma State should thank Phil Knight and T. Boone Pickens and make sure to do whatever they need to do to make sure that the money doesn’t ever stop flowing in!

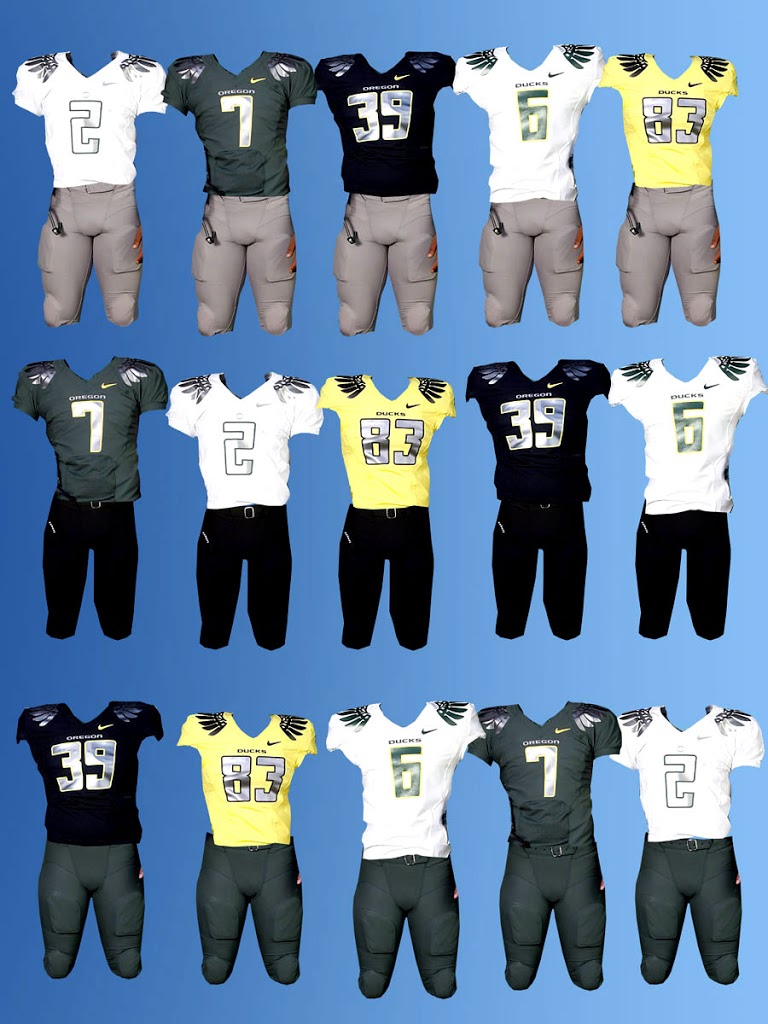
Fun Fact: Since 2004, the Oregon Ducks have not worn the same exact uniform for two games in a row (see pictures below)[2]. I guess money can also buy very nice swag … especially if that money comes from an ex-Nike CEO!
Regression Outputs:
Oregon Ducks – 2008 to 2014 Wins vs. Five Variables of Investment

Oklahoma State Cowboys – 2008 to 2014 Wins vs. Five Variables of Investment

Oregon Ducks – 2008 to 2014 Losses vs. Five Variables of Investment

Oklahoma State Cowboys – 2008 to 2014 Losses vs. Five Variables of Investment